Tuesday, July 31, 2012
Friday, July 27, 2012
Thursday, July 26, 2012
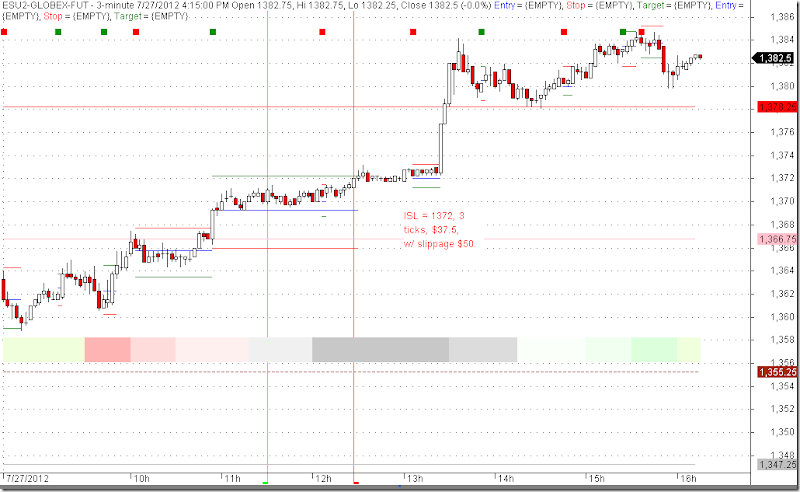
Methodology: Trade the Trader’s Infection Points (TTIP) for intraday emini ES.
Step 1: Find other trader’s infection points on a wider time frame:
- pivot points
- 30min BO systems
- 1 full point from top (bottom) in anticipation of reversal
- Previous HL
- SMA,EMA200
- Fib levels
- Other publicly known S/R levels
Step 2: Idendify R-E-S-T (risk, entry, stop, target) on shorter time frame.
Step 3: Apply Z-turn concept on shorter time frame. Prepared to get stopped out a few times in a row.
- Close above IP’s H for long
- Take profit when target hit or follow the trend until current bar closes below the previous low.
Friday, July 20, 2012
Trend Trading for a Living Part2
p85. Adjust stops and targets at the end of the day. And if you are using a target price as an exit,
lower your target price at each new low if the trade goes
against you (or raise at each new high if short).
p86. Amateurs at the open, pros at the close. Even better: look to enter
your trades within the last two hours of trading. In that
way you are more likely to be in sync with the larger and
more determinative moves caused by professional trading.
p89. Give at least 10 percent of all trading earnings to
charity. The children of John D. Rockefeller were taught
five basic rules regarding money: (a) work for all you get,
(b) give away the first 10 percent, (c) invest the next 10 per-
THE 10 HABITS OF HIGHLY SUCCESSFUL TRADERS 89
cent, (d) live on the rest, (e) and account for every penny.
The Rockefellers believed that giving away their money
was essential to their wealth. And so should you. The secret
is that money multiplies fastest when it’s divided. It’s all
God’s money, in any case. We are merely temporary stewards
of a small portion of God’s abundance. And when this
portion is shared freely with those less fortunate, we prime
the economic pump of the universe.
p90. I encourage you to establish a legacy that will outlive
you. Plant money trees from which others will harvest the
fruit. Ultimately, the only purpose for having wealth is to
help others less fortunate. Wealth shared is true wealth
indeed. The way I see it, God in His grace gave me the
undeserved talent to make money by simply sitting in front
of a computer and clicking a mouse every now and then.
As a result of that gift, we as a family have been able to
travel the world, build a large home, and enjoy some of the
finer things in life. The least I can do is give a healthy portion
of the fruits of that gift back to God’s work in the
world.
p116 General Markets. This is not an exhaustive list by any means, but it is a
good start.
• SPY (S&P 500)—tracks the 500 largest publicly
traded companies
116 TREND TRADING FOR A LIVING
• QQQQ (Nasdaq 100)—tracks the 100 largest
tech, biotech, and telecom companies
Market Cap Indexes
• MDY (S&P Midcaps)—tracks 400 representative
midcap companies
• IWM (Russell 2000)—tracks 2,000 representative
small-cap companies
Sector Indexes
• SMH—semiconductor companies
• IBB—biotech companies
• OIH—oil services companies
• HHH—Internet companies
• RTH—retail companies
• XLF—financial services companies
• XHB—home building companies
p118. Over the course of several
years of watching and trading these broader indexes, we
have come to note five different types of market conditions.
They are:
• Bullish strongly trending
• Bullish weakly trending
• Bearish strongly trending
• Bearish weakly trending
• Range-bound (or nontrending)
In general, we want to focus on long plays in the first two
types of market, short plays in the next two types, and a
mix of longs and shorts in the last type of market.
• The 20 MA is above the 50 MA.
• Both the 20 MA and the 50 MA are rising.
• The distance between the 20 MA and the 50 MA
is large and/or getting larger.
• Pullbacks in price reach only to the 20 MA, or at
the most between the 20 MA and 50 MA; they do
not reach all the way to the 50 MA.
How to Play It Use one of our systems as outlined later.
Here we can say that a bullish strongly trending market is
a great market to be in if you are already long. But if you
are coming late to the party (and hopefully not too late),
your best play is to look for stocks that are breaking out to
new highs from periods of consolidation. You must make
sure these breakout plays are confirmed by the various
technical indicators we use. If price is making a new high
but the indicators are not making new highs, then you have
bearish divergence and you should move on to another
chart.
• The 20 MA is mostly (though not always) above
the 50 MA.
• The 50 MA is rising, but the 20 MA is fluctuating
(though mostly rising).
• The distance between the 20 MA and the 50 MA
changes frequently.
• Pullbacks reach all the way to the 50 MA
(sometimes beyond but only briefly).
How to Play It Use one of our systems outlined later.
Here we can say that a bullish weakly trending market is an
ideal market for trend trading. You should find stocks that
are showing strong trending action (normally stronger than
the general market itself ) but have pulled back to an area
of support. This pullback should be confirmed by oversold
indicators, and the current daily candlestick should put in
a reversal bar of some kind before you consider an entry.
bearish strongly trending markets can end very abruptly if
a short-covering frenzy sets in.
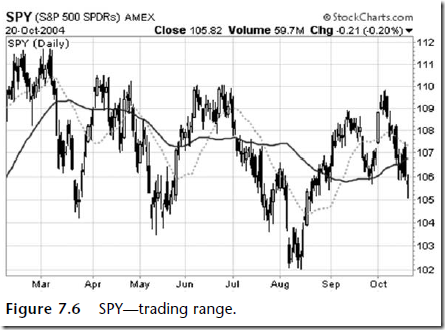
Range-Bound
• The 20 MA spends about as much time above as
below the 50 MA.
• The 50 MA is mostly flat, while the 20 MA varies
from rising to falling.
• The distance between the 20 MA and the 50 MA
varies greatly.
• Rallies and sell-offs easily pass through both
moving averages.
How to Play It Use one of our systems outlined later.
Here it can be said that it is frustrating for traders when a
range-bound market first appears, especially when it follows
a strong up- or downtrend. Traders can be reluctant to transition
from a fast-money, momentum environment (strong
trend) to the more strategic, labor-intensive environment
of the range-bound condition. But once the trading range
is established, it can be an ideal trading environment. In a
trading range, we use trendlines to highlight and delimit the
minitrends within the range and our technical indicators to
spot oversold and overbought levels as well as bullish and
bearish divergence. We are looking to play reversals right
off the pivot points of support and resistance, confirmed by
a break of the intrarange trendline. Indicator divergence is
often a key to locating the best reversal trades and will often
let us pinpoint with extreme accuracy the tops and bottoms
of movements within the range.
p147. 9. There is a lot going on in this chart. Here we have
five distinct market types: how many did you name?
Clearly, on the left side of the chart we are in rangebound
territory. That is easy enough. But then a
sharp drop in the index in July and August tempts
us to say we are in a bearish strong trend. This gets
confirmed when price kisses the 20 MA on a relief
rally and then plunges lower and the 50 MA shows a
downward slope. So that’s the second market type.
But the trend gets negated pretty quickly once price
shoots up above the 50 MA in early September. At
this point we would have to say we are back to a
range-bound market, only the range is now wider.
But then the index keeps going up, and the first
pullback in late September bounces cleanly off the
50 MA without going through it. This gives us
our fourth market type: a bullish weak trend. We
hold to this view until mid-October, when some
PUT YOUR MARKET-READING SKILLS TO THE TEST 147
consolidation brings the index down to the 20 MA
area. Here it holds before pushing strongly higher.
The fact that it never went all the way to the 50 MA
means that now, on the right side of the chart, we
are in a bullish strong trend. This clearly gets
confirmed as the index continues to climb higher,
and the 20 MA moves further and further away
from a rising 50 MA. Give yourself one point for
each market type you recognized (in the right
order). [5 points]
p220~225. 10 setup review. Scan algorithm for divergence in on p172.
Bullish Setups
The pullback: You will favor stocks where . . .
• Volume on the dip to support is lower than
average.
• There is no close during the dip under the 50 MA.
• The trendline supporting the uptrend has not
been violated.
• There is no bearish divergence seen in any of the
indicators.
• Price has not put in a double top formation (two
equal price highs) on the daily chart.
• The weekly chart shows that price is not trading
220 TREND TRADING FOR A LIVING
just under a major weekly moving average (like
the 50 MA or 200 MA).
• Earnings are set to be announced at least two
weeks after entry (to avoid unnecessary volatility).
The coiled spring: You will favor stocks where . . .
• Volume in the coil is lower than average.
• The coil is longer than 7 candles but not longer
than 15 candles.
• There is no close in the coil under the 50 MA.
• There are more green candles (close higher than
the open) in the coil than red candles (close lower
than the open).
• At least two of the RSI, CCI and OBV are rising
during the coil.
• The weekly chart shows that price is not trading
just under a major weekly moving average (like
the 50 MA or 200 MA).
• Earnings are set to be announced at least two
weeks after entry.
The bullish divergence: You will favor stocks where . . .
• You see above-average volume during the last low.
• The last low is near an area of previous price
support, long-term trendline support, or major
moving average support.
• The divergences on the indicators relative to
price are strong (i.e., much lower price low plus
much higher indicator low).
SELECTING BEARISH STOCKS TO TREND-TRADE 221
• There are more than two indicator divergences.
• The last low is more than 10 percent away from
the 20 MA.
• The weekly chart shows that price is not trading
just under a major weekly moving average (like
the 50 MA or 200 MA).
• Earnings are set to be announced at least two
weeks after entry.
The blue sky breakout: You will favor stocks where . . .
• You see above-average volume on the breakout
day.
• The breakout high is the highest price for six
months or more.
• The breakout follows a period of price
consolidation, with several unsuccessful attempts
to break to new highs.
• Earnings are set to be announced at least two
weeks after entry.
The bullish base breakout: You will favor stocks where . . .
• You see above-average volume on the signal day.
• Price has not yet broken out of the bullish base.
• The base is prolonged beyond the minimum time
required.
• There are more green candles in the base than
red candles.
• At least two of the RSI, CCI and OBV are rising
during the base.
222 TREND TRADING FOR A LIVING
• The weekly chart shows the base lying at or near a
major weekly moving average (20, 50, 200).
• Earnings are set to be announced at least two
weeks after entry.
Bearish Setups
The relief rally: You will favor stocks where . . .
• Volume on the rally to resistance is lower than
average.
• There is no close during the dip above the
50 MA.
• The trendline containing the downtrend has not
been violated.
• There is no bullish divergence seen in any of the
indicators.
• Price has not printed in a double bottom or
inverted head-and-shoulders formation on the
daily chart.
• The weekly chart shows that price is not trading
just under a major weekly moving average (like
the 50 MA or 200 MA).
• Earnings are set to be announced at least two
weeks after entry.
The Bearish Divergence: You will favor stocks where . . .
• You see above-average volume during the last
high.
• The last high is near an area of previous price
resistance.
SELECTING BEARISH STOCKS TO TREND-TRADE 223
• The divergences on the indicators relative to
price are strong (i.e., much higher price high plus
much lower indicator high).
• The divergences on the indicators are strong.
• There are more than two indicator divergences.
• The last high is more than 10 percent away from
the 20 MA.
• The weekly chart shows that price is not trading
just under a major weekly moving average (like
the 50 MA or 200 ).
• Earnings are set to be announced at least two
weeks after entry.
The gap down: You will favor stocks where . . .
• You see above-average volume on the gap down
day.
• The high preceding the gap down is at an area of
previous price resistance.
• The high preceding the gap down corresponds to
bearish divergence on one or more of our
primary indicators.
• Earnings are set to be announced at least two
weeks after entry.
The blue sea breakdown: You will favor stocks where . . .
• You see above-average volume on the breakdown
day.
• The breakdown low is the lowest price for six
months or more.
224 TREND TRADING FOR A LIVING
• The breakdown follows a period of price
consolidation, with several unsuccessful attempts
to break to new lows.
• Earnings are set to be announced at least two
weeks after entry.
The rising wedge breakdown: You will favor stocks where . . .
• You see above-average volume on the signal day.
• Price has not yet broken out of the wedge.
• You will favor rising wedges over ascending
triangle wedges.
• There are more red candles in the wedge than
green candles.
• At least two of the RSI, CCI, and OBV are
falling during the wedge.
• The weekly chart shows the wedge lying at or
near a major weekly moving average (20, 50, 200).
• Earnings are set to be announced at least two
weeks after entry.
p297
Trading Teaches Patience. Patience means the goodnatured willingness to suffer (the Latin root of the word patience means “to suffer”) from the delay of an anticipated good. Trading Teaches You How to Listen. The chart is a pictorial form of language. Trading Teaches You How to Be Forgiving. Forgive and forget and move on to the next trade. Trading Teaches You to Hold Your Biases Loosely. “Let the markets do what they want to do!” Trading Teaches You to Be Humble.
p305. THE STRADDLE STRATEGY:

AN 11-POINT REVIEW
The straddle is one of the best trading strategies you can
have in your arsenal of strategies. It takes some practice to
execute correctly, however, so the best advice I can give is
to trade the straddle initially with a very small amount of
OPTIONS STRATEGIES: NEUTRAL 305
capital (you can start with just one contract per side to get
the feel of it). But after an earnings season or two, you
should be able to put straddles on and off with some degree
of comfort.
Here is a review of the system as we outlined it in this
chapter:
1. Get a list of stocks reporting earnings three trading
days from today.
2. Eliminate all stocks not reporting earnings after the
bell.
3. Eliminate all stocks not trading more than 1 million
shares per day.
4. Eliminate all stocks with a beta less than 2.0.
5. Eliminate all stocks priced less than 40.00.
6. Check the chart to determine whether the stock
gapped more than $1.00 at its last two earnings
announcements. Eliminate those that did not.
7. Check the chart to determine whether the stock is
oversold or overbought using the following indicators:
• RSI (5) reading: less than 30 (oversold) or more
than 70 (overbought)
• Stochastics %K (5) reading: less than 25 (oversold)
or more than 75 (overbought)
• CCI (20) reading: less than 100 (oversold) or
more than 100 (overbought)
8. We need agreement from any two of these
indicators to register an oversold or overbought
306 TREND TRADING FOR A LIVING
condition. If we get such a condition, then we will
leg into the trade:
• Buy the calls three days before earnings if oversold.
• Buy the puts three days before earnings if overbought.
• Then buy the other half of the trade before the
close on the day of the earnings announcement.
9. If neither oversold nor overbought, we will buy both
sides of the trade on the day of the announcement.
10. We will buy the same strike price for each side of
the trade, and it will be the nearest strike possible.
The expiration month chosen should follow the
same rules for all options trades, as listed in
Chapter 12.
11. We will hold both sides over the earnings
announcement, then leg out of the trade using the
rules listed in the previous section.
The next thing we want to know is this: where are
these stocks with respect to oversold or overbought levels
three days before earnings are announced?
Thursday, July 19, 2012
StockCharts.com – ChartSchool – Pivot Points
http://stockcharts.com/school/doku.php?id=chart_school:technical_indicators:pivot_points
Pivot Points for 1, 5, 10 and 15 minute charts use the prior day's high, low and close. Pivot Points for 30 and 60 minute charts use the prior week's high, low and close. Pivot Points for daily charts use the prior month's data. Pivot Points for weekly and monthly charts use the prior year's data.
Setting the Tone
The Pivot Point sets the general tone for price action. This is the middle line of the group that is marked (P). A move above the Pivot Point is positive and shows strength. Keep in mind that this Pivot Point is based on the prior period's data. It is put forth in the current period as the first important level. A move above the Pivot Point suggests strength with a target to the first resistance. A break above first resistance shows even more strength with a target to the second resistance level.

The converse is true on the downside. A move below the Pivot Point suggests weakness with a target to the first support level. A break below the first support level shows even more weakness with a target to the second support level.
Support and Resistance
Support and resistance levels based on Pivot Points can be used just like traditional support and resistance levels. The key is to watch price action closely when these levels come into play. Should prices decline to support and then firm, traders can look for a successful test and bounce off support. It often helps to look for a bullish chart pattern or indicator signal to confirm an upturn from support. Similarly, should prices advance to resistance and stall, traders can look for a failure at resistance and decline. Again, chartists should look for a bearish chart pattern or indicator signal to confirm a downturn from resistance.

The second support and resistance levels can also be used to identify potentially overbought and oversold situations. A move above the second resistance level would show strength, but it would also indicate an overbought situation that could give way to a pullback. Similarly, a move below the second support would show weakness, but would also suggest a short-term oversold condition that could give way to a bounce.

Tuesday, July 17, 2012
Trend Trading for a Living Part1
P41
Whatever charting service you use, you should add
the following indicators to your default chart:
• Simple moving averages (SMAs): 20 MA, 50 MA,
200 MA
• Moving average convergence-divergence
(MACD): 12–26–9 periodicity
• Stochastics: 5–3 (or 5–3–3) periodicity
• On balance volume (OBV)
• Relative strength index (RSI): 5 periodicity
• Commodity channel index (CCI): 20 periodicity
Theory:
An MA measures the consensus, or
average, closing price of a stock over a given
period of time.
MACD measures the difference between a
shorter-term consensus of price and a longer-term
consensus, and works on the assumption that when
these diverge, the current price trend is increasing
in strength, and when they converge, the trend is
decreasing in strength.
Stochastics measures the relationship
between the most recent closing price and the
total price range (highs to lows) over a given
period of time. A declining stochastics indicates
that price is tending to close near the lower end of
its recent trading range (bearish), while a rising
stochastics indicates that price is tending to close
near the upper end of its recent trading range
(bullish).
Since OBV is measured by adding the
volume of an up day to a running total of volume
46 TREND TRADING FOR A LIVING
Figure 2.3 SPY with stochastics indicator.
and subtracting the volume of a down day from
that total, it gives us a pictorial image of whether
a stock is being accumulated (more shares being
bought than sold) or distributed (more shares sold
than bought) over time.
RSI is measured by dividing an average of
net positive changes in closing prices over a given
period of time by an average of net negative
changes in price. As this number increases over
time, a bullish trend is confirmed. When the
number decreases, a bearish trend is confirmed.
CCI is calculated by dividing price
increases or decreases over a period of time by a
mean standard deviation of a consensus or average
of price over time. The resulting plotted line of
this calculation will give visual readings of the
strength of current trends as well as indicate
“hidden” strength or weakness during relatively
flat market periods.
p62
you must always be ready to alter your trendlines
in response to new market data. It is all too easy
to draw in a trend channel where none really exists
because we have a predisposed bias to the stock moving
in a certain direction. Trendlines and wishful thinking
are a dangerous combination. For this reason, always
apply the following rule to your use of trend and channel
lines:
No trend or trading channel exists until a line can
be placed on the chart that intersects at least
three price points. Two price points can yield a
trendline, but no trading decision should be made
until a third touch of the line is recorded.
In Figure 2.15, the chart of RIMM demonstrates
Elder’s trendline technique in action. Here we see a downtrend
line and subsequent uptrend line passing through
areas of price congestion rather than at either intraday or
end-of-day price points.
Get out of your mind & into your life : the new acceptance & commitment therapy


