Monday, August 27, 2012

<<MASTERING the CURRENCY MARKET>>

image

image

image

image

the formula is (0.0001/exchange rate) x contract size

image image

image image

image

Watching the Clock

In forex markets, it is widely known by experienced traders that volume
generally trails off noticeably leading up to noon EST and stays
very low until the Tokyo open. Regardless of your own experience
in trading, you do not want to initiate short-term trades that
are based on individual candles or candle formations during
those hours. The exception to this would be U.S. stock indexes
such as the E-mini S&P future and the mini Dow futures contract,
which still have high volume and good trader participation rates.

image

The inside candle is telling us that the market lacks conviction
in regard to its direction. The inside candle is considered
pivotal in that the market is expected to increase
momentum in whichever direction it closes in relation to the
high and low of the inside candle. A close above the high of
the inside candle is considered bullish, and a close below the
low of that candle is considered bearish. When you are viewing
intraday forex charts, keep in mind that low-volume candles
such as those between 17:00 and midnight Greenwich
Mean Time (GMT) should be discounted, as their behavior is
not considered nearly as significant as that of candles on
higher volume.

Two candle formations that often signal a market pause or
reversal are the bullish engulfing pattern and the bearish
engulfing pattern. Both also can be change-of-direction
candles, depending on their close in proximity to the
previous candle’s high or low.

Engulfing != COD candle

Bullish Engulfing: Green body closes above prev red bar’s body.

Bullish COD: Green bar closes above prev bar’s high.

image

A benchmark candle (see Figure 4-9) is an elongated engulfing
candle with few or no wicks and leaves no doubt about
who won out at the end of the candle, the bulls or the bears.

a tendency to pull back in the opposite direction after a benchmark
candle to retest the previous conviction. A rule of thumb
is that if we see a retracement after a benchmark candle, we
should look for it to stop halfway into the candle, giving us
a 50 percent retracement, before resuming the direction set by
the benchmark.

image

followed two candles later by a sharp change-ofdirection
candle higher ahead of the weekend as longer-term,
higher time frame traders take profits ahead of the weekend
.

It is often said in this business that one day does not
make a trend, but one candle can shift a trend, another can reinforce
that shift, and a third can confirm that shift. The study of
individual candles and candlestick formations in all time
frames is an important aspect of trading and is well worth the
time it takes to review their behavior on a regular basis.

THE 13 MOST IMPORTANT U.S. FUNDAMENTAL ANNOUNCEMENTS

TRADING DAYS VERSUS TRENDING DAYS
Trading days are when there are no fundamental announcements. Currency
charts move typically 60 to 90 pips, and sometimes 120 pips, depending on
the currency. Trending days are fundamental announcement days, when the
market will generally take off in a direction after the announcement and
move 120 to 240 pips within the first five hours, incurring a major price
change. It then often stays at that new price for the remainder of the day.
Novice traders prefer trading days as the market is typically more
predictable. Expert traders, however, prefer trending days over trading days
because you can make more money in less time.

At 7 p.m. EST, the Asian markets open (8 a.m. local Asian time) and
continue for approximately 8 hours.
At 3 a.m. EST, the European markets open (8 a.m. local British time)
and continue for approximately 8 hours.
At 8 a.m. EST, the American markets open and continue for 8 hours.

The following are fundamentals announced in the United States:
Purchasing Managers Index (Chicago PMI): This announcement is
based on surveys of more than 200 purchasing managers in the manufacturing
industry who are based in the Chicago area. This distribution of

manufacturing firms mirrors the national distribution in the United States.
Readings above 50 percent indicate an expanding factory sector, whereas
values below 50 percent are indicative of contraction. This announcement
is made on the last business day of every month at 10 a.m. EST.
Consumer Confidence Index (CCI): This is a survey of 5,000
consumers monitoring their attitudes toward the current situation and
expectations regarding economic conditions. This report can occasionally
be helpful in predicting sudden shifts in the economy. It can also give a
trader an idea about the direction of the U.S. economy. Only index changes
of at least five points should be considered significant. The announcement
is made on the last Tuesday of every month at 10 a.m. EST.
Consumer Price Index (CPI): CPI measures the change in price of a
representative basket of goods and services, such as food, energy, housing,
clothing, transportation, medical care, entertainment, and education. It is
also known as the cost-of-living index. It is important because it excludes
food and energy prices for it’s monthly stability, referred to as the core CPI,
and gives a clearer picture of the underlying inflation trend. This announcement
is made around the 13th of every month at 8:30 a.m. EST.
Durable Goods Orders: The official name of this announcement is the
“Advance Report on Durable Goods Manufacturers, Shipments and Orders.”
It is a government index that reflects the dollar volume of orders, shipments,
and unfilled orders of durable goods. Durable goods are new or used items
with a normal life expectancy of three years or more. This generally excludes
defense and transportation orders because of their volatility. This report gives
the trader information on the strength of demand for U.S. manufactured
durable goods—from both domestic and foreign sources. An increase in the
index suggests that demand is strengthening, which may result in rising production
and employment. A falling index obviously indicates the opposite.
The data is released around the 26th of every month at 8:30 a.m. EST.
Employment Situation: This report lists the number of payroll jobs at
all non-farm business establishments and government agencies. The unemployment
rate, average hourly and weekly earnings, and the length of the
average workweek are all listed in this report. This release is the single
most closely watched economic statistic because of its timelines, accuracy,
and its importance as an indicator of economic activity. It plays a big role
in influencing financial market psychology during the month.
Non-farm Payroll Indicator: This fundamental is a co-incident indicator
of economic growth. The greater the increase in employment figures,
the faster the total economy will grow. An increasing unemployment rate is
associated with a contracting economy and declining interest rates. A

decreasing unemployment rate is associated with an expanding economy
and potentially increasing interest rates. The fear is that wages will rise if
the unemployment rate becomes too low and workers are hard to find. The
economy is considered to be at full employment when unemployment is
between 5.5 and 6 percent. The data is released on the first Friday of every
month at 8:30 a.m. EST.
Existing Home Sales: This report measures the selling rate of preowned
houses and is considered a decent indicator of activity in the housing sector.
It provides a gauge of not only the demand for housing but also the economic
momentum. People have to be financially confident in order to buy a house.
The data is announced on the 25th of every month at 10 a.m. EST.
Gross Domestic Product (GDP): GDP measures the dollar value of
goods and services produced within the borders of the United States,
regardless of who owns the assets or the nationality of the labor used in
producing that output. This is the most comprehensive measure of the
performance of the U.S. economy. Healthy GDP growth is between 2.0 and
2.5 percent (when the unemployment rate is between 5.5 and 6 percent). A
higher GDP growth leads to accelerating inflation, and lower growth indicates
a weak economy. This data is released in the third or fourth week of
every month at 8:30 a.m. EST.
New Home Sales: This report is based on interviews with approximately
10,000 builders, or owners of about 15,000 selected building
projects. It measures the number of newly constructed homes with a committed
sale during the month. It is considered an indication of near-term
spending for housing-related items and of consumer spending in general.
However, investors prefer the existing home sales report, which accounts
for around 84 percent of all houses sold earlier in the month.
Philadelphia Fed: This is a regional manufacturing index that covers
Pennsylvania, New Jersey, and Delaware, which represents a reasonable
cross section of national manufacturing activities. Readings above 50 percent
indicate an expanding factory sector, whereas values below 50 percent
indicate contraction. The data is released on the third Thursday of every
month at 10 a.m. EST.
Producer Price Index (PPI): The PPI measures the average price of a
fixed basket of capital and consumer goods at the wholesale level, which
gives a clearer indication of the underlying inflation trend. There are three
primary publication structures for the PPI: industry, commodity, and stageof-
processing. It’s important to monitor the PPI excluding food and energy
prices for its monthly stability. This announcement is made around the 11th
of every month at 8:30 a.m. EST.

Retail Sales: This index measures the total sales of goods by all retail
establishments in the United States (sales of services are not included).
These figures are in current dollars, which means they are not adjusted for
inflation; however, the data is adjusted for seasonal, holiday, and
trading-day differences between months of the year. The retail sales index
is considered the timeliest indicator of broad consumer spending patterns,
providing a sense of the trends among different types of retailers. These
trends can help you spot specific investment opportunities. The data is
released around the 12th of every month at 8:30 a.m. EST.
International Trade: This report measures the difference between
exports and imports of U.S. goods and services. Imports and exports are
important components of aggregate economic activity—representing
approximately 14 percent and 12 percent of the GDP, respectively. Typically,
stronger exports are bullish for the dollar. The data is announced on
the 19th of every month at 8:30 a.m. EST.
The above economic indicators are the most relevant for the six major
world currencies on the Forex market, but that does not mean they are the
only ones. Once again, you can keep up with all major government reports
that affect the Forex at www.markettraders.com or www.forextips.com,
under the heading “Economic Reports”. I strongly suggest you review the
economic calendar daily before you trade in order to be prepared for any
surprise movements in the market.

<<THE 10 ESSENTIALS OF FOREX TRADING>>

Be a good listener to market’s story.  As the market moves, it “tells” a story. 

21-day, 3% rule when learning new knowledge.

Use indicator (not emotion) to determine entry/exit points.  Too many indicators can create confusion.

Candle stick pattern, ideal vs realistic. 

image

image

image

image

image

image

image

image

image

image

image

image

image

image image

image

image

image

image

image

image

image

SMALL a, b, c, d’s FORM INSIDE C, D’s
Now that we know that the market moves at different speeds, we need to look
a little deeper into that movement. If the distance between a C and a potential
D is substantial, and there are no fundamental announcements, the market
often forms small a, b, c, d’s between the C, D. This is important to recognize
because most traders are very impatient and want instant gratification. If a
trader has entered the market long or buying, every time the market begins to
retrace or dip, the trader starts to panic and is tempted to exit.
A good habit to get into is to envision the market movement before you
execute the trade. Draw out how you envision the future wave will be. Try
to figure out the amount of time you will need to be in that trade. Then
decide to be a scalper, a day trader, or a long-term trader before you enter
the market. This will keep you from getting frustrated and emotional as you
trade. You must never forget the ebb and flow of the markets and that these
markets wave. It is a natural wave. Very seldom will they race to your
target, regardless of how much you want them to or how little time you have
set aside for trading. The market moves at its own pace, not ours.

STEPS TO BE FOLLOWED WHEN TRADING AN UPTREND
1. Draw all uptrend lines and downtrend lines, inner, outer, and
long-term. (This will help to determine if the market is in an
uptrend, downtrend, or if a trend line has been broken, signifying
the potential end of a trend or a reversal.)
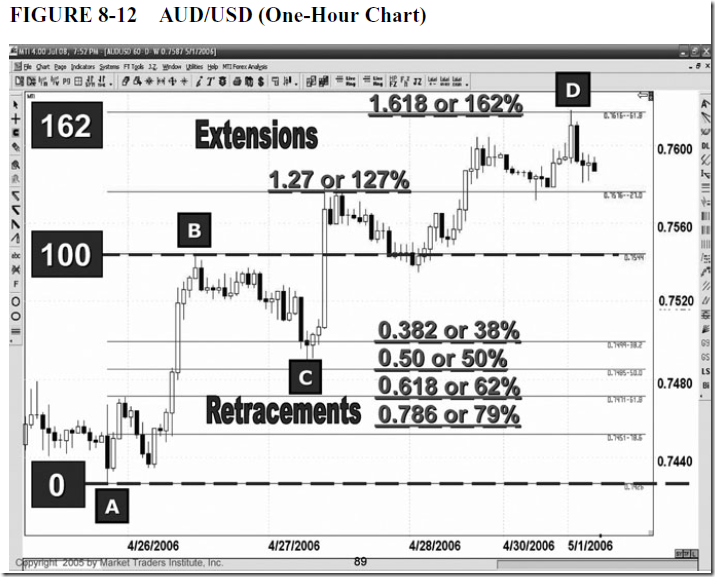
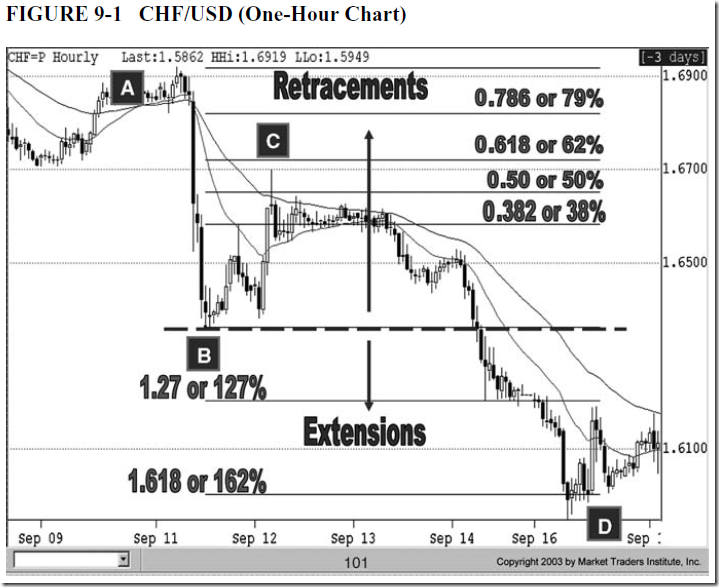
2. Find the latest upward A, B and use the Fibonacci tool on your
trading software to draw the Fibonacci retracement and extension
lines.
3. Find a C buy-entry at a convergence, such as a Fibonacci
retracement level, upward trend line, morning star, tweezer bottom,
or bullish engulfing candle.
4. Find the projected Fibonacci D extension, as well as four levels of
past resistance. Find the closest level of resistance to the Fibonacci
extension. Place a limit exit order 10 pips in front of, or before it
hits, either the Fibonacci extension or the level of resistance
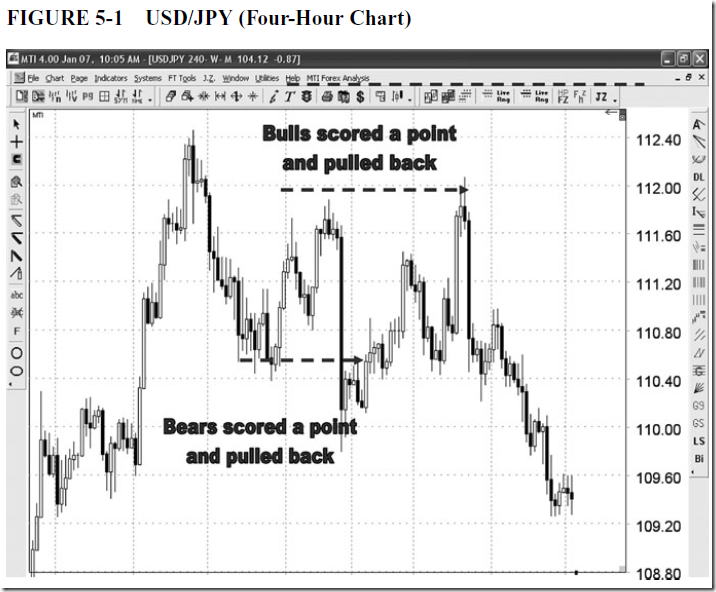
(remember when the bulls score a point it always pulls back).
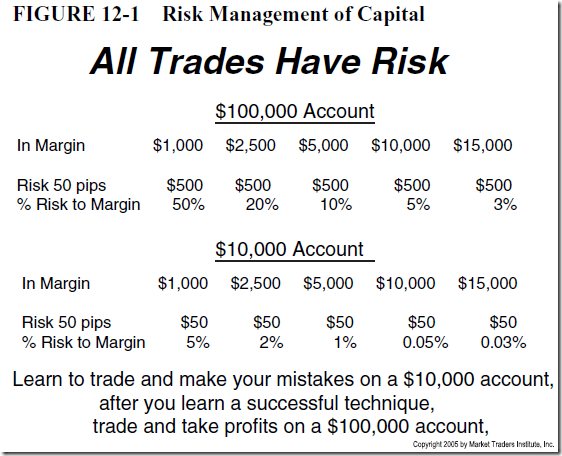
5. Look at your potential financial risk with your protective stop-loss
order. If you can’t afford the potential loss should the trade not work
out, then stay out and do not trade!
6. Pull out your trader’s checklist that you have created or the one
supplied by Market Traders Institute. Create a trading plan and
trade your plan.

image

image

image

image

image

Trap or fake breakout

straddle

This strategy will work provided your broker will allow you to trade this
way (currently at www. I-TradeFX. com, a Forex Broker, you can straddle
the market in this fashion). Please check with your broker first before
attempting to trade using this strategy. Because of the increased volume of
people wanting to trade the fundamentals, not all brokers can handle the
increased trading volume during announcements.
This strategy is called a straddle and was designed for trading in tight
trading ranges in anticipation of a fundamental announcement. It is very
important that there is a fundamental announcement to be released and that
the market range is between 20 and 60 pips. In order to trade a straddle
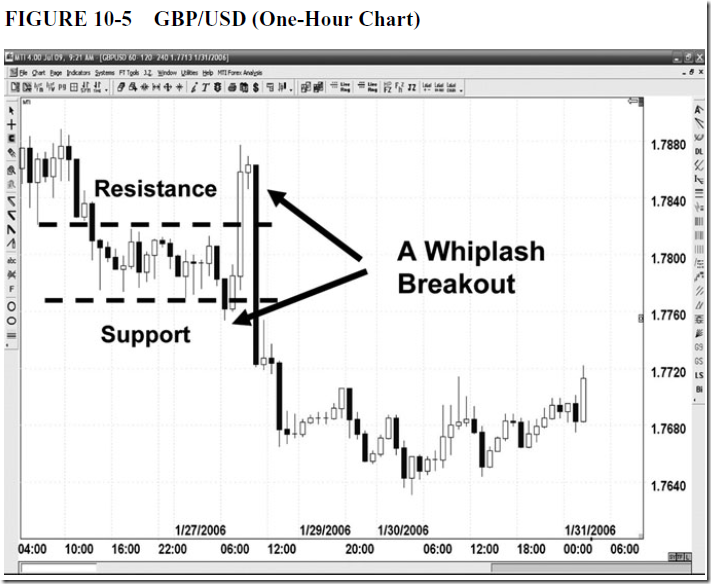
effectively, the market needs to create a tight level of consolidation before
the announcement, which, in turn, will provide a straddle opportunity. As a
rule, the longer the market has been in the range, the more aggressive the
outbreak will be (see Figure 11-6).
When you see consolidation forming before a fundamental announcement,
turn to a smaller time frame, such as a 30-minute chart. Place your
straddle orders five minutes before the announcement is made. Place a buy
order 15 pips above or north of the resistance level and 10 pips below or
south of the level of support, or the trading range. Why 15 pips above
and 10 pips below? All currencies have a bid-ask spread that is between
3 and 5 pips. Place your stop-loss orders 15 pips above the last high for the
sell order and 10 pips below the last low for the buy order. The reason your
buy entry order is 15 pips above the last high is because traders look at
bid charts, which reflect the selling price at a particular moment. Because
there is a spread between the bid and the ask price, we need to add the extra
5 pips to compensate for the difference. This precaution will keep you from
being taken into the market too early.
You should also consider not trading if the trading range of the consolidation
is greater than the amount of money you are willing to lose should
the trade not work out. Always remember that the market can break out in
either direction.
It is important that you create two trading plans with entry points, stoploss
orders, and limit orders for profit in both directions. It is also important
to mentally work through a “what if ” scenario. You need to remember
the market can go north or south. If the market goes south, look for past
levels of support to exit with a profit before the bears score any points and
begin pulling back. The opposite will take place if the buy order is triggered
first—look for past levels of resistance to exit with a profit before the bulls
score any points by taking out those highs or past levels of resistance. Bulls
also pull back after making a new high and scoring a point.

image

image

MaterniT21 PLUS laboratory-developed test

http://articles.marketwatch.com/2012-06-05/finance/32033722_1_blood-tests-amniocentesis-screening

New breakthroughs in prenatal screening

Jeanette Pavini's Buyer Beware

Blood tests offer hope for better accuracy, fewer invasive procedures

SAN FRANCISCO (MarketWatch)—New prenatal screening tests that could improve accuracy and reduce the need for amniocentesis and other potentially risky procedures are becoming widely available to pregnant women in what doctors are calling a new era in genetic testing.

“We’re at a pivotal time in medical history, where the past 20 years of focused work in the field of genetics has now been translated into testing [that’s more affordable and widely available], said Dr. Genevieve L. Fairbrother, a partner at Obstetrics and Gynecology of Atlanta, who also serves as chief of the medical staff at Atlanta’s Northside Hospital.

“This is a screening test on a healthy population and not simply reserved for experimental cases or on people who are already afflicted with a condition,” she said of one of the new tests, the Harmony Prenatal Test from Ariosa Diagnostics. “It’s a game changer because of its accuracy, ease of use and timing early in the pregnancy.”

Until recently, women and their doctors had fewer choices when it came to prenatal testing for fetal genetic conditions such as Down syndrome.

Those choices included, depending on the situation, less precise blood tests or amniocentesis, a procedure in which a sample of amniotic fluid surrounding the fetus is removed and examined, to diagnose or rule out some birth defects and genetic disorders.

Blood tests are “less painful, there is less anxiety,” Fairbrother said. “It’s less scary for patients. ... But for an amnio, you tell them you’re going to stick a 4-inch needle through their abdomen into their uterus and be less than an inch away from their baby—it’s a big decision.”

But, when “you tell them you’re going to draw two more vials of blood when you draw the other vials of blood at the first obstetric visit? They feel like ‘what’s two more? Sure, go ahead,’” she said.

The new blood tests include Ariosa’s Harmony test, Sequenom’s (US:SQNM) MaterniT21 PLUS laboratory-developed test, and Verinata Health’s verifi prenatal test. Ariosa announced last month an agreement with LabCorp (US:LH) that makes its test the first widely available—through LabCorp’s 1,500 patient service centers in the U.S., starting this week.

Dr. Michael Randell, an obstetrician and gynecologist in private practice in Atlanta, said his patients have responded enthusiastically to Ariosa’s Harmony test as a noninvasive option. “An amniocentesis is an invasive procedure that has associated risks, including miscarriage,” Randell said. “Patients are definitely concerned about having an amniocentesis.”

EWW-1Hr

image

Friday, August 24, 2012

<<Marker Maker’s Edge>>

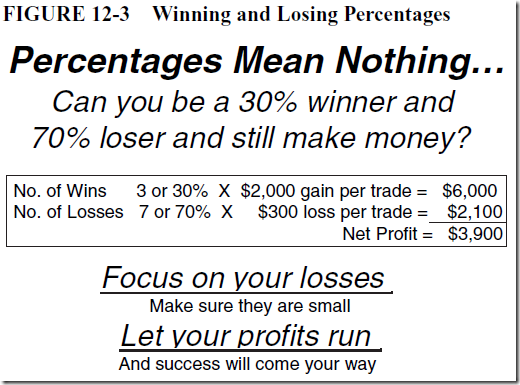
No more than 2% of total portfolio should be lost on any individual trade. 

p48, image

p57, opening price signal.  Above open by 1/4 point.

Price relative to last bar’s H/L/C, current bar’s open, MA8.

p111, image

Avoid the first 5-15 min trading.  Unpredictable.

p169,image

p194,image

image

image

image

same for RSI.

p215, image

same for Williams A/D line.

p226, image

image

Bank Index: BKX; Brokerage Index: XBD

C,BAC,WFC,CMB,ONE;

MER,MWD,GSC

All pictures and tables in the book are captured.